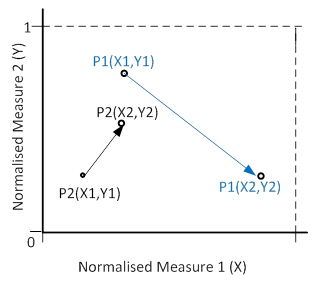
With the help of the tool below, and the dropdown boxes we show some preliminary results from our work on visualising change. We show the individual trajectories of change via ‘scatterplots of change’ (we are still working on the name of the plot!). A simple example of two person’s (P1 and P2) trajectories on two measures (X and Y) at two time points is shown on the figure on the right.
To see results from our sample schools choose one variable for each of measure 1 and measure 2.
The following measures are available for exploration after they had been normalised:
| Measures | Brief description |
|---|
| Ability | Self-report ability in Maths (on a 4-point scale with higher scores indicating higher ability) |
| Disposition | Mathematics disposition is a measure of behavioural intention for future engagement with mathematics (the higher the score the more disposed the student is towards further study or engagement with mathematics) |
| Grade | Maths grades as provided by the teachers |
| Identity | Maths Identity is a measure constructed based on items that express mainly feelings and preferences towards mathematics (the higher the score the more positively/strongly the student relates or identifies with mathematics) |
| MSE | Mathematics self-efficacy denotes confidence in solving mathematical problems. |
| Teaching | Teaching variation is a measure of students’ perception of diversity of the maths lessons (the higher the score the more diverse the classroom) |
| Trans | Teaching transmissionism is a measure of students’ perception of ‘traditional’ or teacher-centered practices in their maths lessons (the higher the score the more traditional/transmissionist the class) |
Once you choose the measures you will be prompted to choose a Year group or a particular class.
Overall data for the selected measures, year/class
Average change (starting)
Average change (finishing)
Data split by gender* for the selected measures, year/class
Average change (starting)
Average change (finishing)
*blue arrows for boys, red arrows for girls
For the first figure that shows individual changes, each arrow shows the changes in measures for one student (from one time point to the next).
In the figures for average change, in each ‘cell’ that has at least one student starting (or finishing), an average vector is taken. The colour intensity of the arrow is an indication of how many students contribute to the average. (solid arrows represent the corresponding “max” number below the figure).